Tag Archive for: trading

Trading Chart, Forex

Forex trading is not a guessing game. It involves analysis of data and constant vigilance on the side of the trader in order to form an intelligent decision when it comes to making an investment. Traders often use a variety of tools and systems in order to help them determine the trends of the market. Using Forex charts is not uncommon as it helps in visualizing the trends and help traders quantify and understand the trends more accurately. Some of the most popular charts used by FX traders are the line, the bar and the candlestick.

The Line Chart

Line-Chart

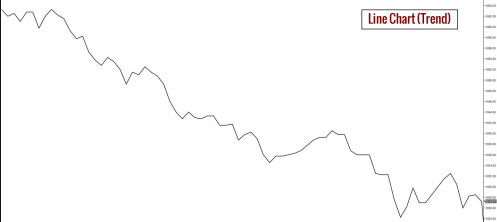
The line chart is the most basic of the three commonly used charts in Forex. Its name is derived from the series of interconnecting lines of data points formed by tracing the patterns of closing prices over a period of time. Relying on the line chart alone is not enough to make an accurate analysis, however, its strength as a tool is due to the clear visual it provides when it comes to data regarding closing prices from one period to another.

Determining the closing price is important for traders as it sets the value of a particular currency of a given market before trading starts again the next day at that same market. It can also be used to better understand the market sentiment on a given trading day by comparing it to the closing price of a previous date.

The Bar Chart

Bar-Chart

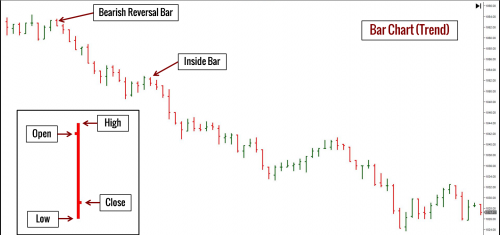
The bar chart is also known as the “OHLC” chart referring to the data displayed on the bar which are the open, high, low and close of a traded currency in a specific market in a given period of time. It is important to first determine the period covered on the chart in order to accurately understand the trend.

As opposed to the interconnected lines in the line chart, the bar chart is represented by vertical lines with horizontal dashes on each side. The topmost part of the bar represents the high.? The dash on the upper part pointing to the right represents the close and the dash on the lower part pointing to the left is the open. The lowest part of the bar represents the low.

The advantage of the bar chart over the line chart is that it allows the trader to analyze not only the opening and closing of a currency price but the highs and lows as well.

The Candlestick Chart

Candlestick-Chart

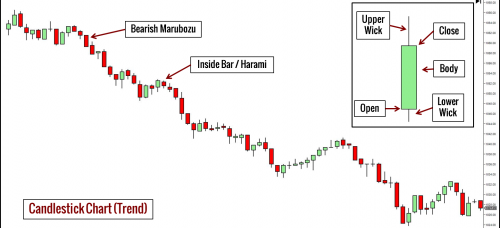
The candlestick chart, also known as the Japanese candlestick chart is probably the most widely used of the three charts but also the most complicated. Its name was derived from its display representation which resembles an upright candlestick with the body representing the price opening and price closing and the wicks on both ends representing the highest price and the lowest price of the day respectively. The term Japanese implies its origin being the analysis tool used in Japanese trading since the 1700s.

The candlestick chart takes into consideration all the variables that are used in both the line and bar chart. In addition to these, it also includes in the analysis the emotion of traders as reflected on the data of a given trading day. As opposed to the other charts which analyze data of a given day’s opening from the closing price of the previous day, the candlestick chart analyzes data from the opening of one particular trading day up to its closing. It also provides for a clearer visual as it uses a color coded approach in representing the uptrend and downtrend of the market. 

Because of its combination approach in analyzing trends, it is thought to be the most accurate of the three commonly used chart analysis tools.

More details regarding types of charts can be found here.

In the past I was typically developing strategies and indicators for automated Forex and Futures trading, using Ninjatrader, Tradingview and Metatrader. But since some time I get more and more requests for trading cryptocurrencies. There are clearly a lot of tools out there for Crypto-trading, however there are in my opinion very basic, typically using Python scripts and missing all nice features you got used to, like backtesting and optimization.

Therefore I want to focus here on options which do exists to my knowledge, automatically trading Cryptocurrencies while using a sophisticated trading environment/tool. With automatically trading I mean using a bot or tool which runs a strategy 24/7 unobserved.

The options listed below are just a quick overview, for detailed description of installation and usage please shoot us an email.

Ninjatrader 8

While NinjaTrader 8 is great in automation and scripting, it does not support trading cryptocurrencies out of the box. But there are now options out there which add Cryptocurrency support to NinjaTrader 8. Clearly the advantage of this solution is the rich and complete scripting (C# .NET language support), backtesting and optimization features of NinjaTrader.

NinjaTrader 8 is free for backtesting w/o any limitation, but must be leased or bought for trading live accounts, however for the Add-Ons listed below, this requirement does not exist.

Coinbase NinjaTrader Integration

The latest NinjaTrader 8 version supports Coinbase API natively. However, it only implements the market data API; it does not allow live-trading.

BitMEX NinjaTrader Integration

Link: see here

This integration allows access to the BitMEX market data, which allows leverages Cryptocurrency trading.

Unfortunately the API only integrates market data, but does not come with trading support. So it can be leveraged for backtesting e.g. XBTUSD in NinjaTrader 8, but for live-trading someone has to look for another solution.

Poloniex, Binance, Bitfinex, Deribit, BinancePlus Add-Ons

Link: see here

The Add-Ons are typically in the $150 to $250 area. If added to NinjaTrader they allow to access market data, but also enable trading of Cryptocurrencies.

I personally use the Binance adapter for some time, and didn’t find any bigger issues. One minor issue seems to be the fact that NinjaTrader’s internal performance handler can’t deal with split order executions, where one split has the size 0; this seems to happen only at certain Crypto-exchanges.

However, these Add-Ons don’t have the official NinjaTrader blessing, so you can’t expect any support from the NinjaTrader. 

Tradingview and Autoview Chrome extension

Tradingview is a great tool in regard to charting, quick implementation of ideas, it supports a zillion of Crypto-exchanges, but lacks automation. Latter is clearly a big minus. However, even if supported the question would remain how useful it would be running a strategy 24/7 in a Chrome browser environment.

That being said, there is a Chrome extension out there, called Autoview, which uses Tradingview Pine script alerts to trigger orders. Bit disadvantage of this solution is that there is no feedback about the trades, it’s basically submitting orders blindly into the dark 

The Chrome extension costs $5 per month, or $50 per year and can be found here: https://autoview.with.pink/. Tradingview is free, but also provides subscriptions, which do enable more features.

The built-in Pine script feature allows to add own strategies and indicators. But the features of Pine are clearly limited and can hardly be compared with the scripting capability of NinjaTrader for instance.

Please shoot us an email for any detailed question about the NinjaTrader and Tradingview features and support.