Tradingview strategy vs study markers2

Tradingview made a big step ahead in 2019 by introducing webhooks, which can be used finally to automate Tradingview scripts. Clearly this approach still has its limits due to the missing feedback channel back to the Tradingview script; it’s still submitting orders into a black hole and hope they get executed as intended.

The following steps describe how a Tradingview Pine script can be connected to Alertatron. For details how Alertatron works and how the overall command-set looks like, please take a look here.

I hope that the following steps do explain how to automate a Tradingview script via Alertatron. If you have questions, or want to automate another script, please contact me.

Setting up Alertatron

If you don’t have a login at Alertatron, please create one.

Then create a new set of API keys bby clicking on “Configure API Keys”.
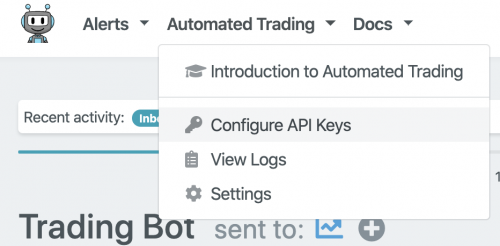
Setup Alertatron 1

In the now appearing dialog select the exchange you want to submit your orders to, a unique name for the key (only characters, no numbers), the “Key” and the “Secret”. Click on “Add API keys and restart service”.
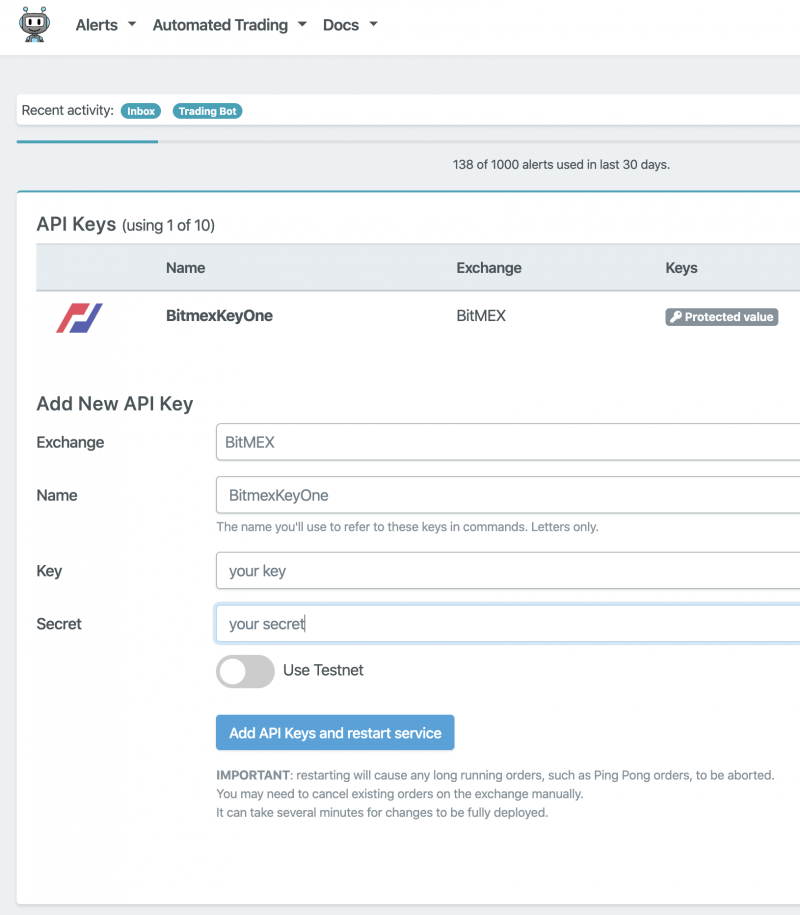
Setup Alertatron 2

Setting up the Tradingview Pine script

Tradingview “study” scripts can be automated by using the built-in function alertcondition. Via the alertcondition message attribute a static/const message can be predefined, which can be used as a preset for the next step in Tradingview to connect the alertcondition to an alert, which is hosted in the Tradingview server-side. Please keep in mind that until today, the message attribute is a const string, that means it can not be assembled dynamically at the runtime of the script!

The example below shows two messages: one for entering a long and one for entering a short position. The tag “#bot” is required to connect the following instruction to a trading bot at Alertatron; Alertatron also supports Telegram messages for instance. The term “BitmexKeyOne(XBTUSD)” defines the name of the keys you have entered at Alertatron, and XBTUSD defines the instrument you want to trade at the exchange. Everything else within the curly brackets is the command set defined by Alertatron, to:

  1. cancel all open orders
  2. create a long/short market order wit the targeted position size of 25
  3. create a OCO profit-target and stop-loss order, when the previous long/short market order has been executed

All these sets could also be separated, and the Tradingview Pine script could manage the profit and stop-loss orders. But, Alertatron provides the mechanism to take care of complex orders, and it can submit these follow-up orders faster w/o any delay, while the executing of the Pine script depends on the used settings. Also, Crypto-APIs, like Bitmex REST API, are notorious for being not accessible when the market is going strongly up or down; that would mean that profit and stop-loss orders will be executed with a delay or not at all.

alertcondition(condEnterLong, title='Enter Long', 
   message='Enter Long 
      #bot BitmexKeyOne(XBTUSD) { 
         cancel(which=all); 
         managed(side=buy, 
            position=25, 
            entry=market, 
            takeProfit=1.0%, 
            stopLoss=2.0%) }')
alertcondition(condEnterShort, title='Enter Short', 
   message='Enter Short 
      #bot BitmexKeyOne(XBTUSD) { 
         cancel(which=all); 
         managed(side=sell, 
            position=-25, 
            entry=market, 
            takeProfit=1.0%, 
            stopLoss=2.0%) }')

Enabling the Alert(s) in Tradingview

alertconditions by itself cannot trigger any email or popup or webhook. They need to be manually enabled in the Tradingview environment to generate a real alert.

1. Please select the “study” script for which you want to enable an alert, click on the 3 dots, and select “Add Alert on …”

Tradingview enable alerts 1

2. In the Alert pop-up dialog select

  • how often the alert shall be triggered – recommended setting here is “Once Per Bar” or “Once Per Bar Close”
  • the alert actions; check the box for “Webhook URL” (provided by Alertatron)
  • modify the predefined message with the Alertatron instructions
  • click on “Create”. This creates an alert which is hosted on the Tradingview server-side; the number of alerts someone can create depends on the Tradingview subscription type. The alerts are hosted off you local machine, so you don’t need to keep your PC and browser running!
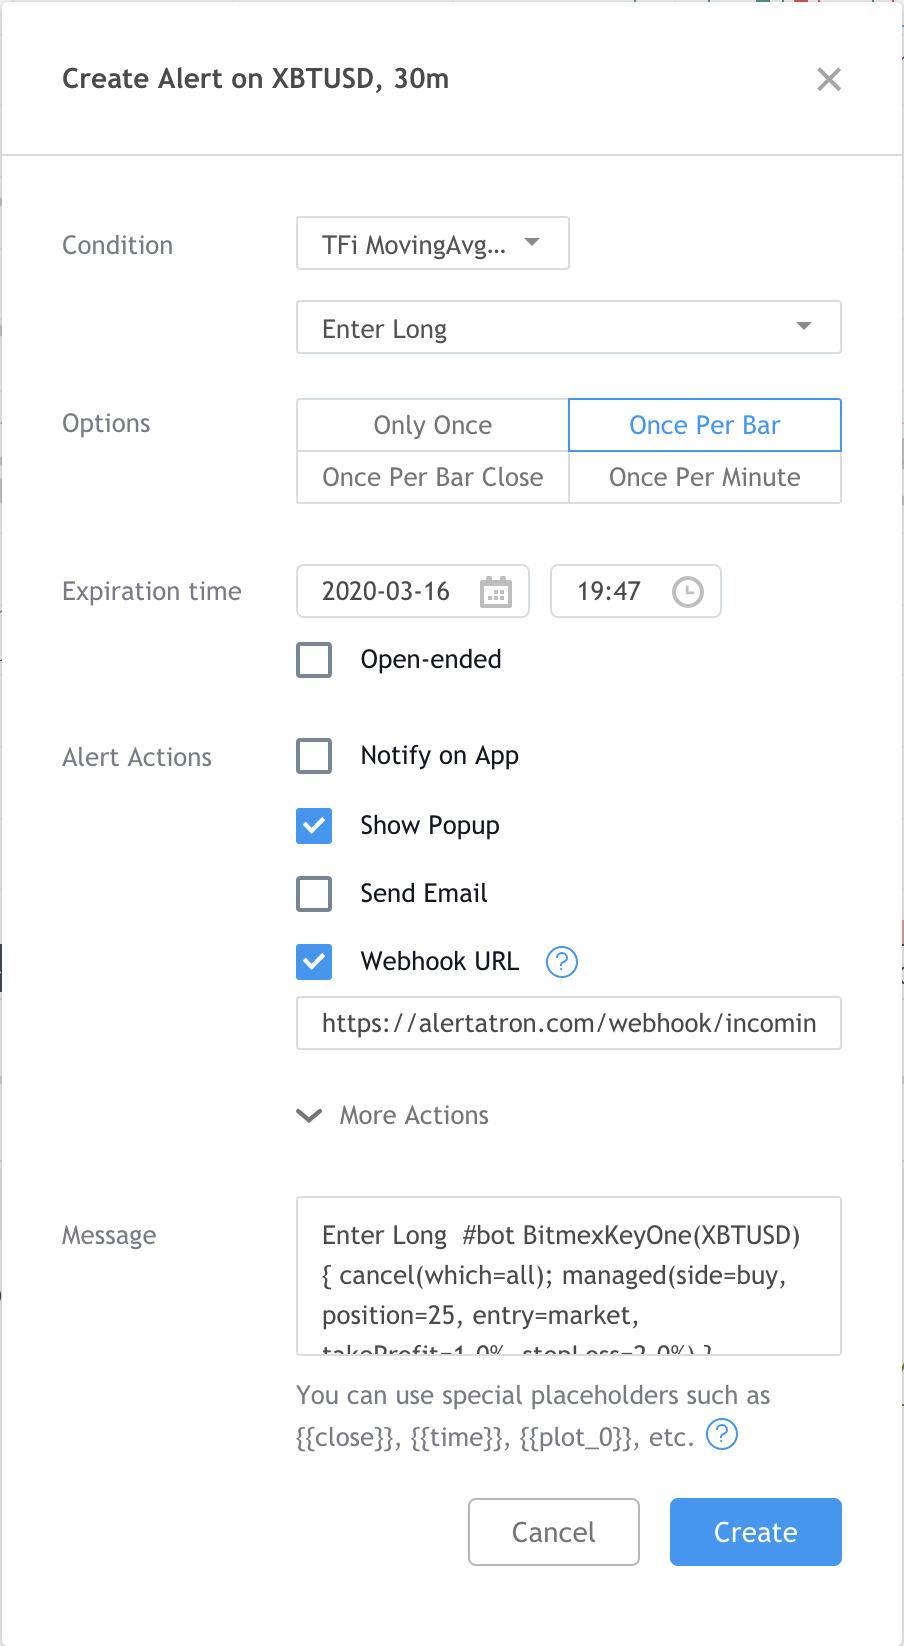
Tradingview enable alerts 2

Tradingview strategy vs study markers2

Tradingview’s “study” and “strategy” scripts behave quite differently, when backtesting the “strategy” and try to match the behavior of the “study” script.

First thing what is different is the missing support for all startegy.xyz functions in a “study” script. This requires that that the internal Tradingview backtest-engine behavior must be reengineered in the “study”, which leads to considerable more lines of script code.

Then, the “strategy” script is executed once at the end of each bar; if that happens the script can go through all conditions which might trigger a new positions and submits the order via strategy.entry function. This order is getting executed at the beginning of the next bar using the close price (if simple market order).

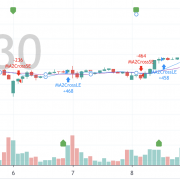
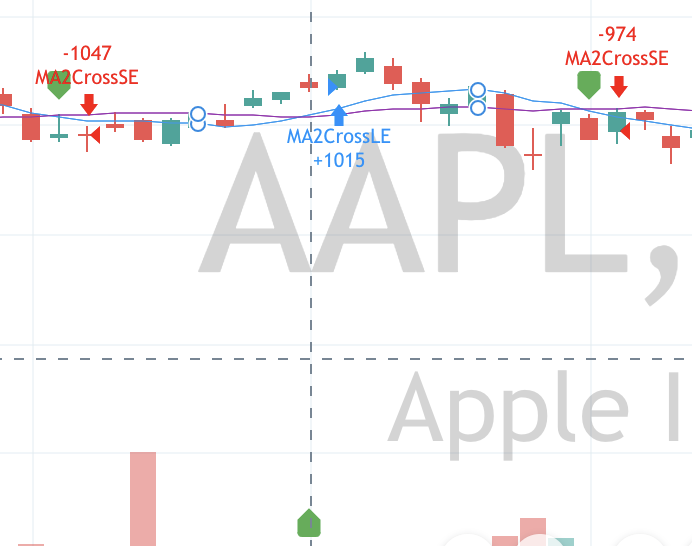
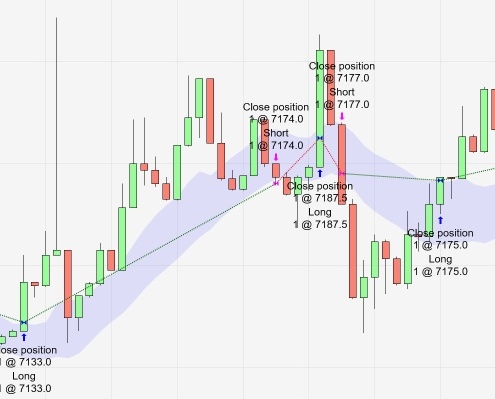
When running the “study”, which mimics the code of the “strategy”, when running with historical data, the script is also only called once at the end of each bar. Same behavior here: the “study” can check for conditions and mark the position entry/exit in chart by using Tradingview’s plot functions for instance. It can also raise alertcondition, which can be hooked up in Tradingview to emails, webhooks and so on. But as demonstrated in the screenshot below, the “study” script plots the marker exactly at the bar where the entry/exit conditions were detected, while the “strategy” shows entry/exit points in the next bar. This can be quite confusing, but please keep in mind this is still the backtest behavior. If dealing with realtime data, the behavior between “strategy” and “study” and be aligned, if using “tick mode” for “strategy” and “study” or “end-of-bar mode” for “strategy” and “study”.

Tradingview strategy vs study markers

Tradingview Status Box

Tradingview’s proprietary Pine script has clearly its limitation, but in script version 4 Tradingview has added a couple of useful features.

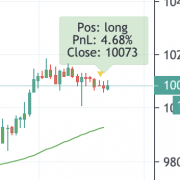
One of them is the option to add labels to the chart, which can used to render a status box, which might show important position parameters. The code below shows a simple example for how to add a status box to the last bar, which shows current position (long, short, flat), the current profit and the current price. It renders the box in green if profit is positive, red if negative and blue if neutral.

The status box can also be seen in action here on Tradingview.

posColor = color.new(color.green, 75)
negColor = color.new(color.red, 75)
dftColor = color.new(color.blue, 75)
posProfit= (strategy.position_size != 0) ? (close * 100 / strategy.position_avg_price - 100) : 0.0
posDir   = (strategy.position_size  > 0) ? "long" : strategy.position_size < 0 ? "short" : "flat"
posCol   = (posProfit > 0) ? posColor : (posProfit < 0) ? negColor : dftColor

var label lb = na
label.delete(lb)
lb := label.new(bar_index, max(high, highest(5)[1]),
   color=posCol,
   text="Pos: "+ posDir +
      "\nPnL: "+tostring(posProfit, "#.##")+"%" +
      "\nClose: "+tostring(close, "#.##"))
ChannelBreakout

creen Shot ChannelBreakout

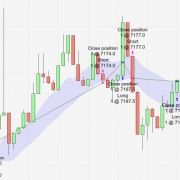
We were backtesting a Channel-Breakout strategy for a customer for some time on Tradingview and later in NinjaTrader 8. The backtesting results on both platforms were very promising, specifically for lower Minute timeframes, e.g. 1min. The Channel-Breakout strategy is using Market orders for entering long and short positions; the strategy is always in a trade all the time.

The Strategy was actually losing money!

While live-trading on BitMEX via NinjaTrader 8 the chart entry and exit points still looked good, however the daily trading results in BitMEX showed a different picture; basically the strategy was losing every day a bit of the account money on BitMEX. The key factor which we were not considering were the trading fees at BitMEX. It differentiates between Taker-Fees for Market Orders and Maker-Fees for Limit Orders (fee structure explained here). The Taker-Fee is 0.075% of the traded value, so if using a higher margin value this fee increases accordingly. Using Market Orders for entering a long position and exiting the same position adds up to 0.15% of the whole trading value. In clear text, the strategy has to gain at least 0.15% to breakeven before even make a single cent. This is the critical part if using a scalping strategy for lower Minute timeframes. The strategy typically made 60-70% positive trades, which were mostly in the 0.1..0.2% effective gain area, so finally including the BitMEX fees the strategy effectively was losing money.

How to run a scalping strategy in BitMEX and not losing money?

Use Limit orders wherever possible! BitMEX pays  a Maker-Fee of 0.025% for using Limit Orders, which are contributing to make the market for BitMEX. By using Limit Orders, a strategy using this order type only could add 0.05% of the order value to its balance sheet for every trade (enter and exit).

This is unfortunately not always that simple. The Channel-Breakout strategy does not work well using a Stop-Limit Order instead of a Stop-Market Order for entering the market. The limit order gets simply executed too late – typically then, if the market has turned again and instead of being in a delayed long position the strategy should be in a short position. The solution was to use Market Orders for entering a position and pay the 0.075% fee and use Limit-Orders for existing a position if a certain profit target has been reached. So finally the strategy paid additional 0.075% for entering a position and got 0.025% back when exiting. This finally reduced the trading fees by two-third from 0.15% to 0.05% (0.075%-0.025%), which finally made the trades profitable including the gain and fees.

Implementation

The strategy is using the BitMEX NinjaTrader 8 adapter for accessing the data feed. Unfortunately this adapter does not support any trading functions.

For submitting orders, we have added our own C# BitMEX Trading API, which is accessing the BitMEX REST API. This API supports the basic functions for submitting market/limit and stop orders, and has a function to request the current order status. The order status is available inside the NinjaTrader 8 strategy, similar to a “unmanaged” Ninjatrader 8 strategy. The order status has to be retrieved from BitMEX asynchronously from within the strategy, as the REST API is poll-based. This is realized as a timer callback inside the NinjaTrader 8 strategy, which pulls the status of all orders every 2seconds. The frequency for pulling the order status can be configured; clearly someone needs to pay attention to the BitMEX API rate-limit, which allows roughly 1 request in average per second.

This solution works quite nice, but it’s a good approach to implement the strategy in a way to submit orders as limit or stop-market orders ahead. Because BitMEX API is notorious for being not accessible in case of strong up or down trends, where their server seems to reach their limits.

Questions & Contact

Please contact us know if you are interested in using this API, or if you are interested in the implementation of a similar strategy.

Trading Chart, Forex

Forex trading is not a guessing game. It involves analysis of data and constant vigilance on the side of the trader in order to form an intelligent decision when it comes to making an investment. Traders often use a variety of tools and systems in order to help them determine the trends of the market. Using Forex charts is not uncommon as it helps in visualizing the trends and help traders quantify and understand the trends more accurately. Some of the most popular charts used by FX traders are the line, the bar and the candlestick.

The Line Chart

Line-Chart

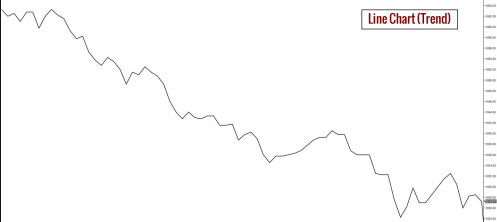
The line chart is the most basic of the three commonly used charts in Forex. Its name is derived from the series of interconnecting lines of data points formed by tracing the patterns of closing prices over a period of time. Relying on the line chart alone is not enough to make an accurate analysis, however, its strength as a tool is due to the clear visual it provides when it comes to data regarding closing prices from one period to another.

Determining the closing price is important for traders as it sets the value of a particular currency of a given market before trading starts again the next day at that same market. It can also be used to better understand the market sentiment on a given trading day by comparing it to the closing price of a previous date.

The Bar Chart

Bar-Chart

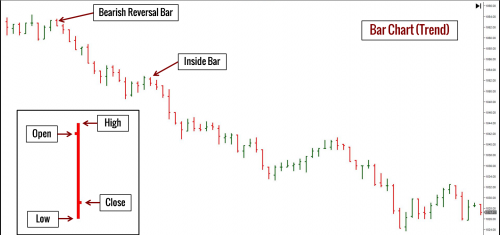
The bar chart is also known as the “OHLC” chart referring to the data displayed on the bar which are the open, high, low and close of a traded currency in a specific market in a given period of time. It is important to first determine the period covered on the chart in order to accurately understand the trend.

As opposed to the interconnected lines in the line chart, the bar chart is represented by vertical lines with horizontal dashes on each side. The topmost part of the bar represents the high.? The dash on the upper part pointing to the right represents the close and the dash on the lower part pointing to the left is the open. The lowest part of the bar represents the low.

The advantage of the bar chart over the line chart is that it allows the trader to analyze not only the opening and closing of a currency price but the highs and lows as well.

The Candlestick Chart

Candlestick-Chart

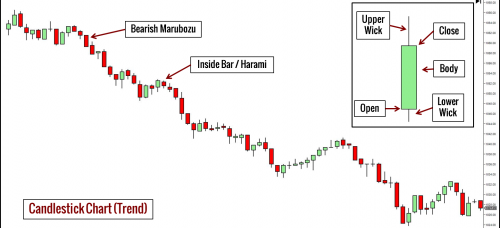
The candlestick chart, also known as the Japanese candlestick chart is probably the most widely used of the three charts but also the most complicated. Its name was derived from its display representation which resembles an upright candlestick with the body representing the price opening and price closing and the wicks on both ends representing the highest price and the lowest price of the day respectively. The term Japanese implies its origin being the analysis tool used in Japanese trading since the 1700s.

The candlestick chart takes into consideration all the variables that are used in both the line and bar chart. In addition to these, it also includes in the analysis the emotion of traders as reflected on the data of a given trading day. As opposed to the other charts which analyze data of a given day’s opening from the closing price of the previous day, the candlestick chart analyzes data from the opening of one particular trading day up to its closing. It also provides for a clearer visual as it uses a color coded approach in representing the uptrend and downtrend of the market. 

Because of its combination approach in analyzing trends, it is thought to be the most accurate of the three commonly used chart analysis tools.

More details regarding types of charts can be found here.

NinjaTrader Logo
NinjaTrader stores all user configurations, indicators and strategies in this folder C:\Users\<user>\Documents\NinjaTrader 7\bin\Custom. NT does not allow to change the folder.
But it is possible to link a folder from somewhere else. E.g. you could store all your settings in your Dropbox folder and just link it to the NinjaTrader target folder.
 
Steps:
  • Run cmd. exe as Administrator
  • Execute mklink /D “C:\Users\<user>\Documents\NinjaTrader 7\bin\Custom” “C:\Users\<user>\Dropbox\Data\NinjaTrader\NinjaTrader 7\bin\Custom”
  • Use rmdir <link> to just remove the link
NinjaTrader Logo
NinjaTrader 7 uses a GridControl to let the user modify strategy or indicator properties. Properties marked with certain tags will be shown automatically in the Grid.
Example:
[Description("Numbers of bars used for calculations")]
[GridCategory("Parameters")]
public int Period {
    get {return iPeriod;} 
    set {iPeriod = Math.Max(1, value);}
}
It is possible to hide parameters in the GridControl dynamically. For supporting  this feature the strategy has to implement the interface ICustomTypeDescriptor. The property which allows to modify the visibility of other properties in the GridControl has to get additionally the tag RefreshProperties(RefreshProperties.All). Finally the function ModifyProperties implements the visibility handling.
public class tF_TestAnn : Strategy, ICustomTypeDescriptor
{
        [Description("ANN trade mode.")]
        [GridCategory("Parameters")]
        [RefreshProperties(RefreshProperties.All)]
        public  ENAnnMode AnnMode { get; set; }
 
        private void ModifyProperties(PropertyDescriptorCollection col)
        {
            if( AnnMode != ENAnnMode.Backtest )
            {
                col.Remove(col.Find("NetType", true));
            }
            if( AnnMode != ENAnnMode.Live )
            {
                col.Remove(col.Find("BuyLevel", true));
            }
        }

        public AttributeCollection GetAttributes()
        {
            return TypeDescriptor.GetAttributes(GetType());
        }

        public string GetClassName()
        {
            return TypeDescriptor.GetClassName(GetType());
        }

        public string GetComponentName()
        {
            return TypeDescriptor.GetComponentName(GetType());
        }

        public TypeConverter GetConverter()
        {
            return TypeDescriptor.GetConverter(GetType());
        }

        public EventDescriptor GetDefaultEvent()
        {
            return TypeDescriptor.GetDefaultEvent(GetType());
        }

        public PropertyDescriptor GetDefaultProperty()
        {
            return TypeDescriptor.GetDefaultProperty(GetType());
        }

        public object GetEditor(Type editorBaseType)
        {
            return TypeDescriptor.GetEditor(GetType(), editorBaseType);
        }

        public EventDescriptorCollection GetEvents(Attribute[] attributes)
        {
            return TypeDescriptor.GetEvents(GetType(), attributes);
        }

        public EventDescriptorCollection GetEvents()
        {
            return TypeDescriptor.GetEvents(GetType());
        }

        public PropertyDescriptorCollection GetProperties(Attribute[] attributes)
        {
            PropertyDescriptorCollection orig = TypeDescriptor.GetProperties(GetType(), attributes);
            PropertyDescriptor[] arr = new PropertyDescriptor[orig.Count];
            orig.CopyTo(arr, 0);
            PropertyDescriptorCollection col = new PropertyDescriptorCollection(arr);

            ModifyProperties(col);
            return col;

        }

        public PropertyDescriptorCollection GetProperties()
        {
            return TypeDescriptor.GetProperties(GetType());
        }

        public object GetPropertyOwner(PropertyDescriptor pd)
        {
            return this;
        }
}
NinjaTrader Logo

If you are planning to run your strategy within a chart window and your strategy requires an asynchronous execution or event, you can trigger this via dynamic buttons in the tool bar of the chart window.

In the code below the creation of the buttons and the event handler is implemented in a separate class. CStripButton is created in the OnStartUp context and disposed in the OnTermination context. A button click calls a callback implemented in the strategy class.

public class CStripButton
{
    private ToolStrip           toolStrip           = null;
    private ToolStripButton     toolStripBtnA       = null;
    private ToolStripButton     toolStripBtnB       = null;
    private ToolStripSeparator  toolStripSeparator  = null;

    private Strategy            clStrategy;
    private StripButtonCallback fnCallback;        

    public CStripButton( Strategy _clStrategy, StripButtonCallback _fnCallback )
    {
        clStrategy = _clStrategy;
        fnCallback = _fnCallback;
 
        System.Windows.Forms.Control[] control =
  _clStrategy.ChartControl.Controls.Find( "tsrTool", false );
 
        if( control.Length > 0 )
        {
            toolStrip = (ToolStrip)control[0];

            toolStripSeparator              = new ToolStripSeparator();
            toolStrip.Items.Add( toolStripSeparator );

            toolStripBtnA                = new ToolStripButton( "btnA" );
            toolStripBtnA.Text           = "Button A";
            toolStripBtnA.Click         += btnClick;
            toolStrip.Items.Add( toolStripBtnA );

            toolStripBtnB                = new ToolStripButton( "btnB" );
            toolStripBtnB.Text           = "Button B";
            toolStripBtnB.Click         += btnClick;
            toolStrip.Items.Add( toolStripBtnB );
        }
    }

    /// <summary>
    /// Destructor.
    /// </summary>
    public void Dispose()
    {
        if( toolStrip != null )
        {
            toolStrip.Items.Remove( toolStripSeparator );
            toolStrip.Items.Remove( toolStripBtnA );
            toolStrip.Items.Remove( toolStripBtnB );
        }
    }
 
    /// <summary>
    /// Button click handler.
    /// </summary>
    private void btnClick( object sender, EventArgs e )
    {            
        if( MessageBox.Show( 
             "Are you sure you want to continue?", 
             "Button pressed", 
             MessageBoxButtons.YesNo, 
             MessageBoxIcon.Question ) != DialogResult.Yes )
            return;

        var _bak = toolStripBtnTrain.BackColor;
        toolStripBtnTrain.BackColor = Color.Green;

        fnCallback( sender.ToString() );
 
        toolStripBtnTrain.BackColor = _bak;
    }
}

In the past I was typically developing strategies and indicators for automated Forex and Futures trading, using Ninjatrader, Tradingview and Metatrader. But since some time I get more and more requests for trading cryptocurrencies. There are clearly a lot of tools out there for Crypto-trading, however there are in my opinion very basic, typically using Python scripts and missing all nice features you got used to, like backtesting and optimization.

Therefore I want to focus here on options which do exists to my knowledge, automatically trading Cryptocurrencies while using a sophisticated trading environment/tool. With automatically trading I mean using a bot or tool which runs a strategy 24/7 unobserved.

The options listed below are just a quick overview, for detailed description of installation and usage please shoot us an email.

Ninjatrader 8

While NinjaTrader 8 is great in automation and scripting, it does not support trading cryptocurrencies out of the box. But there are now options out there which add Cryptocurrency support to NinjaTrader 8. Clearly the advantage of this solution is the rich and complete scripting (C# .NET language support), backtesting and optimization features of NinjaTrader.

NinjaTrader 8 is free for backtesting w/o any limitation, but must be leased or bought for trading live accounts, however for the Add-Ons listed below, this requirement does not exist.

Coinbase NinjaTrader Integration

The latest NinjaTrader 8 version supports Coinbase API natively. However, it only implements the market data API; it does not allow live-trading.

BitMEX NinjaTrader Integration

Link: see here

This integration allows access to the BitMEX market data, which allows leverages Cryptocurrency trading.

Unfortunately the API only integrates market data, but does not come with trading support. So it can be leveraged for backtesting e.g. XBTUSD in NinjaTrader 8, but for live-trading someone has to look for another solution.

Poloniex, Binance, Bitfinex, Deribit, BinancePlus Add-Ons

Link: see here

The Add-Ons are typically in the $150 to $250 area. If added to NinjaTrader they allow to access market data, but also enable trading of Cryptocurrencies.

I personally use the Binance adapter for some time, and didn’t find any bigger issues. One minor issue seems to be the fact that NinjaTrader’s internal performance handler can’t deal with split order executions, where one split has the size 0; this seems to happen only at certain Crypto-exchanges.

However, these Add-Ons don’t have the official NinjaTrader blessing, so you can’t expect any support from the NinjaTrader. 

Tradingview and Autoview Chrome extension

Tradingview is a great tool in regard to charting, quick implementation of ideas, it supports a zillion of Crypto-exchanges, but lacks automation. Latter is clearly a big minus. However, even if supported the question would remain how useful it would be running a strategy 24/7 in a Chrome browser environment.

That being said, there is a Chrome extension out there, called Autoview, which uses Tradingview Pine script alerts to trigger orders. Bit disadvantage of this solution is that there is no feedback about the trades, it’s basically submitting orders blindly into the dark 

The Chrome extension costs $5 per month, or $50 per year and can be found here: https://autoview.with.pink/. Tradingview is free, but also provides subscriptions, which do enable more features.

The built-in Pine script feature allows to add own strategies and indicators. But the features of Pine are clearly limited and can hardly be compared with the scripting capability of NinjaTrader for instance.

Please shoot us an email for any detailed question about the NinjaTrader and Tradingview features and support.